![[DBPP]](pictures//asm_color_tiny.gif)


![[Search]](pictures//search_motif.gif)
Cheng [58] surveys parallel programming tools, including tools for performance data collection and analysis. Reed [240] provides both a useful review of techniques for parallel performance analysis and an introduction to Pablo. Reed et al. [241] provide a more detailed description of Pablo, including its sound and virtual reality displays. Herrarte and Lusk [148] describe Upshot. Heath and Etheridge [139] describe Paragraph, and Heath [138] presents case studies showing how it is used to tune parallel program performance. Kesselman [104,172] provides a detailed description of Gauge; while originally developed for the parallel languages Strand and PCN, a general-purpose implementation is under development. Ries et al. [244] describe Intel's ParAide system. Yan et al. [301] describe AIMS.
Graham et al. [124] describe the sampling approach to profiling sequential programs. Lamport [185] discusses clock synchronization algorithms. Tufte [285] provides a wonderful introduction to the visual presentation of multidimensional data.
Other systems not described here include Cray Research's MPP Apprentice, which provides integrated performance analysis, optimization, and prediction capabilities; Thinking Machines's Prism system, which provides specialized analysis capabilities for data-parallel programs; Parasoft's Express message-passing system, which provides execution profiling, communication profiling, and event trace analysis mechanisms; Applied Parallel Research's HPF profiler; and the IPS-2 system from University of Wisconsin Madison [207]. Other systems are described in a conference proceedings edited by Haring and Kotsis [132].

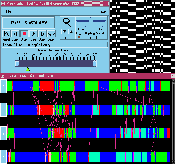
(GIF 63484 bytes; RGB 772383 bytes.) Plate 15: IBM's VT trace analysis tool. Image courtesy of IBM.
Here is a Web Tour providing access to additional information on performance tools, including public domain implementations, documentation, tutorials, and examples of performance tool output.
![[DBPP]](pictures//asm_color_tiny.gif)


![[Search]](pictures//search_motif.gif)
© Copyright 1995 by Ian Foster